Historical Southeast Alaska Herring Catch
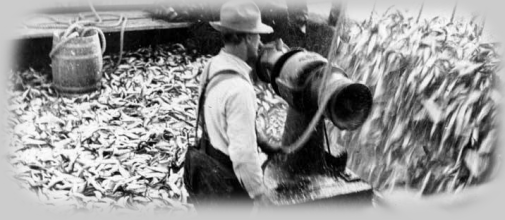
(Alaska State Library Place File ASL-Craig-3, ASL-P01-0952, Alaska State Library--click to enlarge from source)
----WARNING: "Beta" Draft Status This page is still under development!!
---Text may be somewhat readable but is not yet complete---
Reduction Fishery
Records of catch and production from early Southeast Alaska herring reduction plants appear in a number of places. Occasional visitors to the Killisnoo plant for example, such as Scidmore (1885, 1893 and her section in the 1890 census given in U.S. Dept. of Interior 1893) and Inkersley (1895) would record catch from information given to them at the plant. More official-looking catch tabulations are given in Moser (1899) and by the meticulous John N. Cobb (Cobb 1906 is particularly thorough). However, these later "official" authors acquire their data one or two decades after the initial visitors, and after the Killisnoo plant changes ownership. All available historical records were examined and attempts were made to reconcile disparate figures. Table 1 lists the available sources of catch and indicates what appeared to be the most reliable source or "best blend" of the catch information, through the closure of the last plant in 1966.
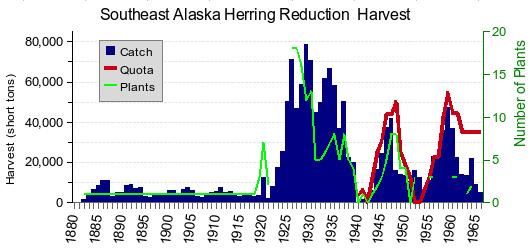
Figure 1. Southeast Alaska herring reduction fishery catch, quota, and number of operating plants, 1880-1966, based on Table 1.
Herring catch shows a long period of more-or-less constant catch, ranging from 4,000 to 10,000 tons, from 1880 through 1918, when Killisnoo was the only operating plant. It might be argued that these harvests were sustainable regionally, or at least at the edge of sustainabilty. With the intensive capitilization in the early 1920s, there followed three waves of "boom-and-bust" cycles, where peak catches exceeded 40,000 tons annually. By this time, the paucity of herring during the bust cycles had attracted federal regulators, and quotas were enacted to preserve herring for other uses (food, bait, prey for other species). Note that the quotas always lag the catch in the declining phase of each cycle. Fishermen are first unable to find enough fish to catch the quota, then the quota is lowered in the subsequent year. There was no stock assessment focused on abundance estimation, so quotas merely reflected fishing experience from the prior year. The number of operating plants peaks in 1928; as the efficiency of factory processes and vessels increased, fewer plants, fishermen, and vessels could attain the same production as in the earlier, more labor-intensive era.
Table 1. Summary of Southeastern Alaska Reduction Fishery Harvests. The source of (“best blend” of catch estimates is indicated by color and source footnote).
| Summary of Southeastern Alaska Reduction Fishery Harvests. | ||||||||||
| (“Best Blend” indicated by color and source footnote) | ||||||||||
| Source | ||||||||||
| Moser | Cobb | Annual Fish/Fur | Rounsefell | Skud | Reid | Board of | ||||
| (1899) | (1906) | Seal Rpts. 1906-1912 | (1930) | (1960) | (1971) | Fisheries Reports | Best | Quota | ||
| Year | a | b | c-i | j | k | l | m | Blend | l | |
| 1878 | 0 | 0 | b | |||||||
| 1879 | 0 | 0 | b | |||||||
| 1880 | 2 | 2 | b | |||||||
| 1881 | 0 | 0 | b | |||||||
| 1882 | 1,240 | 1,520 | 1,520 | b | ||||||
| 1883 | 4,200 | 4,200 | 4,200 | b | ||||||
| 1884 | 6,600 | 6,600 | 6,600 | b | ||||||
| 1885 | 8,500 | 8,500 | 8,500 | b | ||||||
| 1886 | 11,000 | 11,000 | 11,000 | b | ||||||
| 1887 | 11,100 | 11,100 | 11,100 | b | ||||||
| 1888 | 3,000 | 3,000 | 3,000 | b | ||||||
| 1889 | 5,246 | 5,246 | 5,246 | b | ||||||
| 1890 | 5,242 | 5,242 | 5,242 | b | ||||||
| 1891 | 8,822 | 8,760 | 8,760 | b | ||||||
| 1892 | 9,358 | 9,358 | 9,358 | b | ||||||
| 1893 | 7,225 | 7,225 | 7,225 | b | ||||||
| 1894 | 7,590 | 7,590 | 7,590 | b | ||||||
| 1895 | 3,224 | 3,224 | 3,224 | b | ||||||
| 1896 | 2,759 | 2,759 | 2,759 | b | ||||||
| 1897 | 3,501 | 3,501 | 3,501 | b | ||||||
| 1898 | 4,443 | 4,443 | b | |||||||
| 1899 | 3,552 | 3,552 | b | |||||||
| 1900 | 6,006 | 1,194 | 6,006 | b | ||||||
| 1901 | 6,275 | 1,250 | 6,275 | b | ||||||
| 1902 | 4,087 | 812 | 4,087 | b | ||||||
| 1903 | 6,522 | 1,494 | 6,522 | b | ||||||
| 1904 | 7,631 | 1,521 | 7,631 | b | ||||||
| 1905 | 6,364 | 1,309 | 6,364 | b | ||||||
| 1906 | 3,350 | 1,005 | 3,350 | c | ||||||
| 1907 | 2,480 | 1,382 | 2,480 | d | ||||||
| 1908 | 3,756 | 1,711 | 3,756 | e | ||||||
| 1909 | 5,200 | 1,075 | 5,200 | f | ||||||
| 1910 | 5,887 | 5,890 | 6,867 | 5,890 | j | |||||
| 1911 | 9,570 | 7,526 | 12,057 | 7,526 | j | |||||
| 1912 | 6,830 | 5,270 | 16,067 | 5,270 | j | |||||
| 1913 | 5,830 | 13,496 | 5,830 | j | ||||||
| 1914 | 4,320 | 8,318 | 4,320 | j | ||||||
| 1915 | 2,918 | 6,964 | 2,918 | j | ||||||
| 1916 | 4,237 | 11,194 | 4,237 | j | ||||||
| 1917 | 4,618 | 12,445 | 4,618 | j | ||||||
| 1918 | 3,085 | 17,825 | 3,085 | j | ||||||
| 1919 | 3,665 | 10,962 | 3,665 | j | ||||||
| 1920 | 12,760 | 16,452 | 12,760 | j | ||||||
| 1921 | 2,265 | 6,012 | 2,265 | j | ||||||
| 1922 | 8,279 | 16,950 | 8,279 | j | ||||||
| 1923 | 17,464 | 21,240 | 17,464 | j | ||||||
| 1924 | 25,316 | 29,395 | 25,316 | j | ||||||
| 1925 | 50,430 | 57,782 | 50,430 | j | ||||||
| 1926 | 70,978 | 73,843 | 70,978 | j | ||||||
| 1927 | 46,913 | 45,310 | 46,913 | j | ||||||
| 1928 | 58,776 | 53,007 | 58,776 | j | ||||||
| 1929 | 78,749 | 78,778 | 78,749 | 78,778 | l | |||||
| 1930 | 70,855 | 70,854 | 70,855 | 70,854 | l | |||||
| 1931 | 44,857 | 44,858 | 44,857 | 44,858 | l | |||||
| 1932 | 49,786 | 49,785 | 49,786 | 49,785 | l | |||||
| 1933 | 61,588 | 61,587 | 61,588 | 61,587 | l | |||||
| 1934 | 66,842 | 66,842 | 66,842 | 66,842 | l | |||||
| 1935 | 58,155 | 58,155 | 58,155 | 58,155 | l | |||||
| 1936 | 36,713 | 36,712 | 36,713 | 36,712 | l | |||||
| 1937 | 50,334 | 50,333 | 50,334 | 50,333 | l | |||||
| 1938 | 22,356 | 22,356 | 22,356 | 22,356 | l | |||||
| 1939 | 20,028 | 20,027 | 20,028 | 20,027 | l | |||||
| 1940 | 0 | 0 | 3,137 | 0 | l | 3,750 | ||||
| 1941 | 1,917 | 1,915 | 6,230 | 1,915 | l | 6,250 | ||||
| 1942 | 0 | 0 | 3,691 | 0 | l | 250 | ||||
| 1943 | 6,235 | 6,235 | 6,235 | 6,235 | l | 12,500 | ||||
| 1944 | 16,801 | 16,802 | 16,801 | 16,802 | l | 25,000 | ||||
| 1945 | 24,126 | 24,523 | 24,126 | 24,523 | l | 31,250 | ||||
| 1946 | 37,564 | 37,564 | 37,564 | 37,564 | l | 43,750 | ||||
| 1947 | 41,829 | 41,828 | 41,829 | 41,828 | l | 43,750 | ||||
| 1948 | 16,125 | 16,114 | 16,125 | 16,114 | l | 50,000 | ||||
| 1949 | 14,279 | 14,278 | 14,279 | 14,278 | l | 25,000 | ||||
| 1950 | 13,411 | 13,409 | 13,411 | 13,409 | l | 18,750 | ||||
| 1951 | 10,652 | 10,652 | 10,652 | 10,652 | l | 12,500 | ||||
| 1952 | 16,020 | 16,020 | 16,020 | 16,020 | l | 0 | ||||
| 1953 | 12,435 | 12,435 | 12,435 | 12,435 | l | 0 | ||||
| 1954 | 6,446 | 6,446 | 6,446 | 6,446 | l | 6,250 | ||||
| 1955 | 11,368 | 11,368 | 11,368 | 11,368 | l | 12,500 | ||||
| 1956 | 22,819 | 22,819 | 22,819 | 22,819 | l | 22,500 | ||||
| 1957 | 22,938 | 24,745 | 22,938 | l | 22,500 | |||||
| 1958 | 36,185 | 38,797 | 36,185 | l | 42,500 | |||||
| 1959 | 47,623 | 49,866 | 47,623 | l | 54,500 | |||||
| 1960 | 36,706 | 38,906 | 36,706 | l | 44,500 | |||||
| 1961 | 22,766 | 24,709 | 22,766 | l | 44,500 | |||||
| 1962 | 13,977 | 16,959 | 13,977 | l | 35,000 | |||||
| 1963 | 13,517 | 15,703 | 13,517 | l | 35,000 | |||||
| 1964 | 22,128 | 23,553 | 22,128 | l | 35,000 | |||||
| 1965 | 9,268 | 12,390 | 9,268 | l | 35,000 | |||||
| 1966 | 5,073 | 5,670 | 5,073 | l | 35,000 | |||||
| Sources: | ||||||||||
| a | Moser, J.N. 1899. The salmon and salmon fisheries of Alaska. Bulletin of the | |||||||||
| United States Fish Commission for 1898 18:1-178.) Page 124. | ||||||||||
| b | Cobb, J.N. 1906. The commercial fisheries of Alaska in 1905. Bureau of Commercial | |||||||||
| Fisheries Document 603. | ||||||||||
| c | Cobb, J.N. 1907. Report on the fisheries of Alaska in 1906. Bureau of Commercial Fisheries Document No. 618. | |||||||||
| All figures from text on page 53-54, except Central Alaska production and fertilizer and oil from table on page 10. | ||||||||||
| d | Marsh, M.C., and J.N. Cobb. 1908. The fisheries of Alaska in 1907. Bureau of Commercial Fisheries Document No. 632. | |||||||||
| All figures from table at bottom of page 54, except Central Alaska production and fertilizer and oil from | ||||||||||
| large table entitled "Products of the Alaska fisheries in 1907", and raw herring utilized for reduction from | ||||||||||
| text on page 55. | ||||||||||
| e | Marsh, M.C., and J.N. Cobb. 1909. The fisheries of Alaska in 1908. Bureau of Commercial Fisheries Document No. 645. | |||||||||
| All figures from table at the bottom of page 65, except reduction figures from text at top of page 66. | ||||||||||
| f | Marsh, M.C., and J.N. Cobb. 1910. The fisheries of Alaska in 1909. Bureau of Commercial Fisheries Document No. 730. | |||||||||
| Reduction fishery figures from text on page 48. Text on page 48 describes an active, growing herring | ||||||||||
| bait fishery, but does not give harvests. | ||||||||||
| g | Marsh, M.C., and J.N. Cobb. 1911. The fisheries of Alaska in 1910. Bureau of Commercial Fisheries Document No. 746. | |||||||||
| All figures from table on top of page 51, except herring utilized for reduction taken from text on page 51. | ||||||||||
| h | Evermann, B.W. 1912. Alaska fisheries and fur industries in 1911. Bureau of Commercial Fisheries Document No. 766. | |||||||||
| All figures from table on bottom of page 62. No reduction utilization mentioned, so this was calculated | ||||||||||
| I | Evermann, B.W. 1913. Alaska fisheries and fur industries in 1912. Bureau of Commercial Fisheries Document No. 780. | |||||||||
| All figures from table on bottom of page 60. No reduction utilization mentioned, so this was calculated | ||||||||||
| j | Rounsefell, G.A. 1930. Contribution to the biology of the Pacific herring, Clupea pallasii, and the condition of | |||||||||
| the fishery in Alaska. Bulletin of the U.S. Bureau of Commercial Fisheries 45:227-320. | ||||||||||
| k | Skud, B.E., H.M. Sakuda, and G.M. Reid. 1960. Statistics of the Alaska Herring Fishery 1878-1956. | |||||||||
| U.S. Fish and Wildlife Service Statistical Digest 48. 21p. | ||||||||||
| l | Reid, G.M. 1971. Age composition , weight, length, and sex of herring, Clupea pallasii, used for reduction | |||||||||
| in Alaska, 1929-66. NOAA Technical Report NMFS SSRF 634, Seattle. | ||||||||||
| m | Board of Fisheries Report Tables: these do not list sources and contain minor discrepancies with | |||||||||
| historical data; historical data are felt to be more reliable. | ||||||||||
Back to: History of Southeast Alaska Herring Fisheries
Link to: References
Caution: These pages contain preliminary research results, and are presented here only to further collaborative research and analysis. The information presented has not been fully analyzed or verified for correctness. Please consult the original literature citations for authentic interpretations or contact the author regarding applications of any analysis presented on these pages.
For more information, contact Fritz Funk:
fritz funk.io
| Last modified: Apr 12, 2008 at 21:14:42
funk.io
| Last modified: Apr 12, 2008 at 21:14:42
This page is standards-compliant:
|
![]() |
|
 |
|
![]() |
|
 |
|